After some finagling with Google Drive/Sheets API, I managed to update the python script to insert values directly into a Google Sheet. Following the official docs including setting up OAuth was a breeze, and my worst tripup was carelessly naming the .json file containing the secret key "token.json" (which is actually the refresh token to be generated upon initial authentication, and constantly updated to avoid expiry) instead of "credentials.json". Also had to add the user name to the test list in the API console. Once these rookie mistakes were fixed, the API worked pretty flawlessly. The next thing I'd like to do is maybe sandbox the access to a single file through the SCOPE parameter, instead of all the spreadsheets (or entire drive for that matter). Double checks to make sure I didn't publicly check in the private keys...
I placed one sensor inside, while another is sitting on the balcony, like so:

Here's the raw data plots after a few hours, with 20 minute polling intervals:
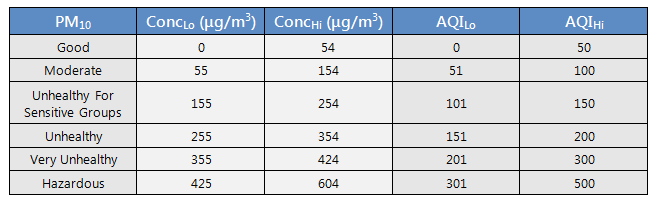
Nothing exciting to show yet, other than pretty close readings from both sensors both inside and outside. Some things to consider doing in the future include converting the values into Air Quality Index (AQI). The gist of the conversion is that for a given particle/pollutant, there are piecewise linear ranges (or "breakpoints") as the amount of pollutant goes up. For example, for PM2.5:
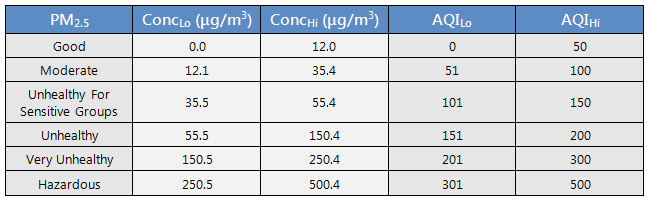
At "Good" concentrations of between 0 and 12 ug/m^3, it maps to 0-50 on the index. However, at the next "moderate" level (12.1-35.4 ug/m^3), we have a range of 23 ug/m^3 for the 50-100 on the index values. Interestingly enough for the 3rd range (35.5-55.4 ug/m^3), the range goes down to 20 ug/m^3 but then the forth range is 55.5-150.4 which is 100. I guess this must be based on some kind of prior knowledge on the potential health effects at different concentrations... We see a similar pattern for the PM10 values in that the ranges are increasing up to a certain level but then goes down at the "Very Unhealthy" level: